P·15 · Machine Learning
Traffic Flow Analysis with Computer Vision
A YOLOv8 pipeline that counts and tracks vehicles from stitched video in place of hand counts, plus a new traffic-efficiency equation.
At a glance
- >80%less traffic-data labor, per Hawaii's head of traffic at the DOT
- +17%efficiency of Waipahu High School's traffic methodology
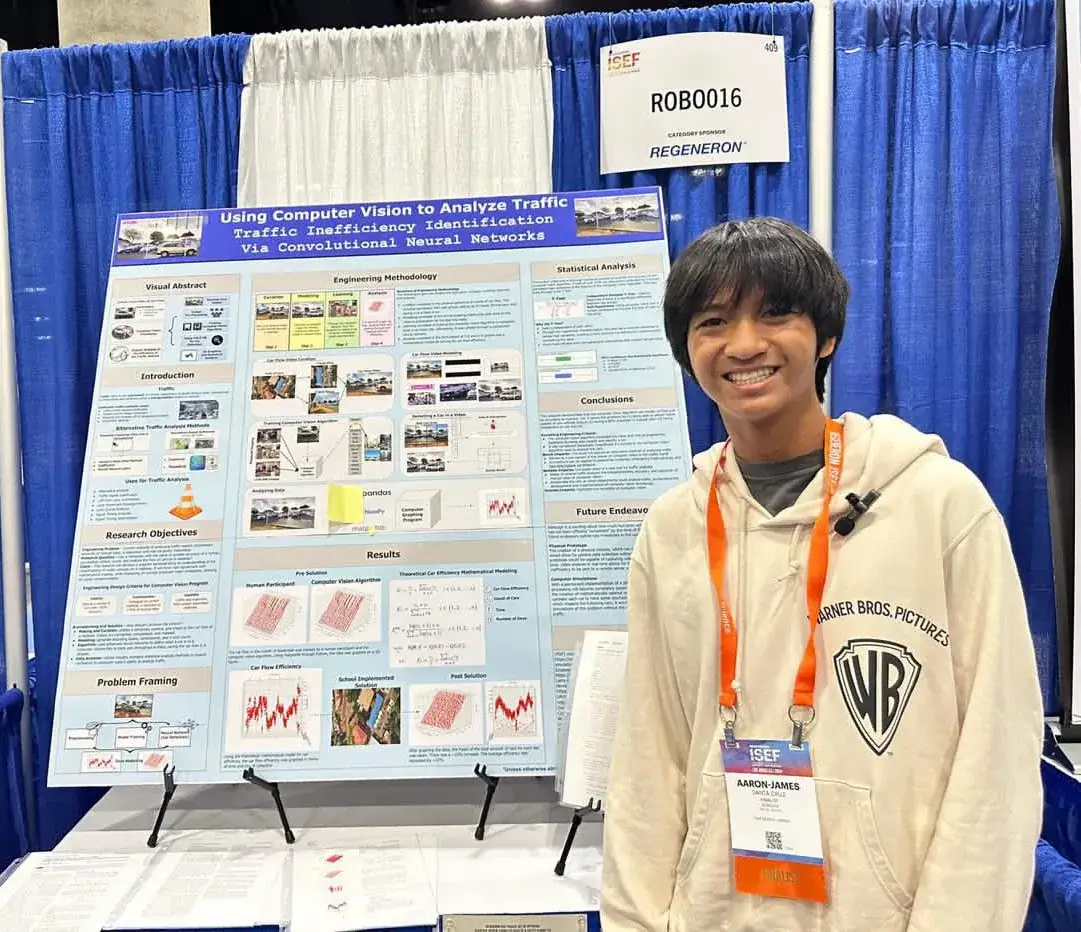
- ISEFInternational Science and Engineering Fair finalist, plus two special awards
- Where
- High school research, ISEF finalist
- Role
- Researcher and developer
- Team
- 2 (me, and my brother on the efficiency model)
- Timeline
- Six months of field testing
- Status
- Complete
- Python
- YOLOv8
- Computer vision
- Object detection and tracking
- Image stitching (mosaic)
- Traffic flow modeling
- Simulation optimization
The problem
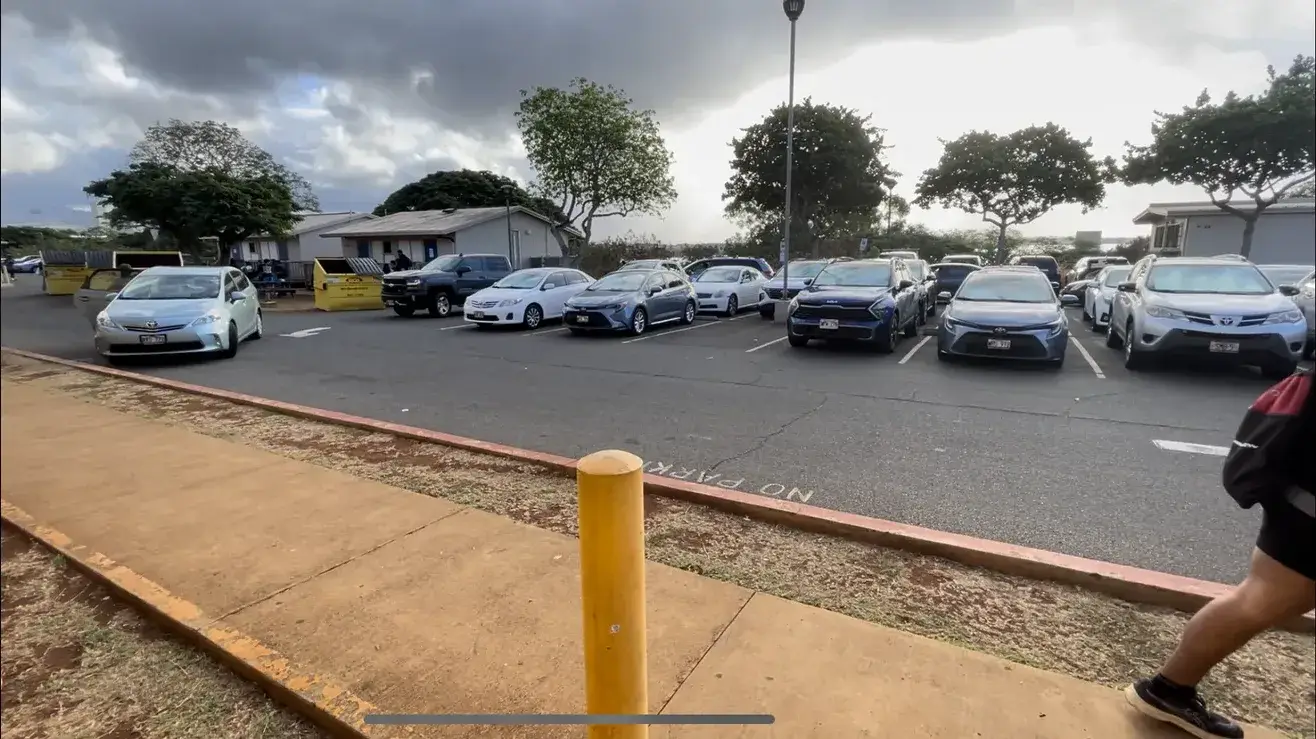
In Hawaii, traffic-efficiency data is gathered by people counting vehicles by hand, which is slow and labor-intensive. I talked with the head of traffic at Hawaii’s Department of Transportation about what they needed, and set out to automate the counting with computer vision.
A second problem sits underneath: many existing traffic-efficiency models depend on a time hyperparameter, which limits how flexibly they apply to different roads and periods.
Approach
Capturing the video
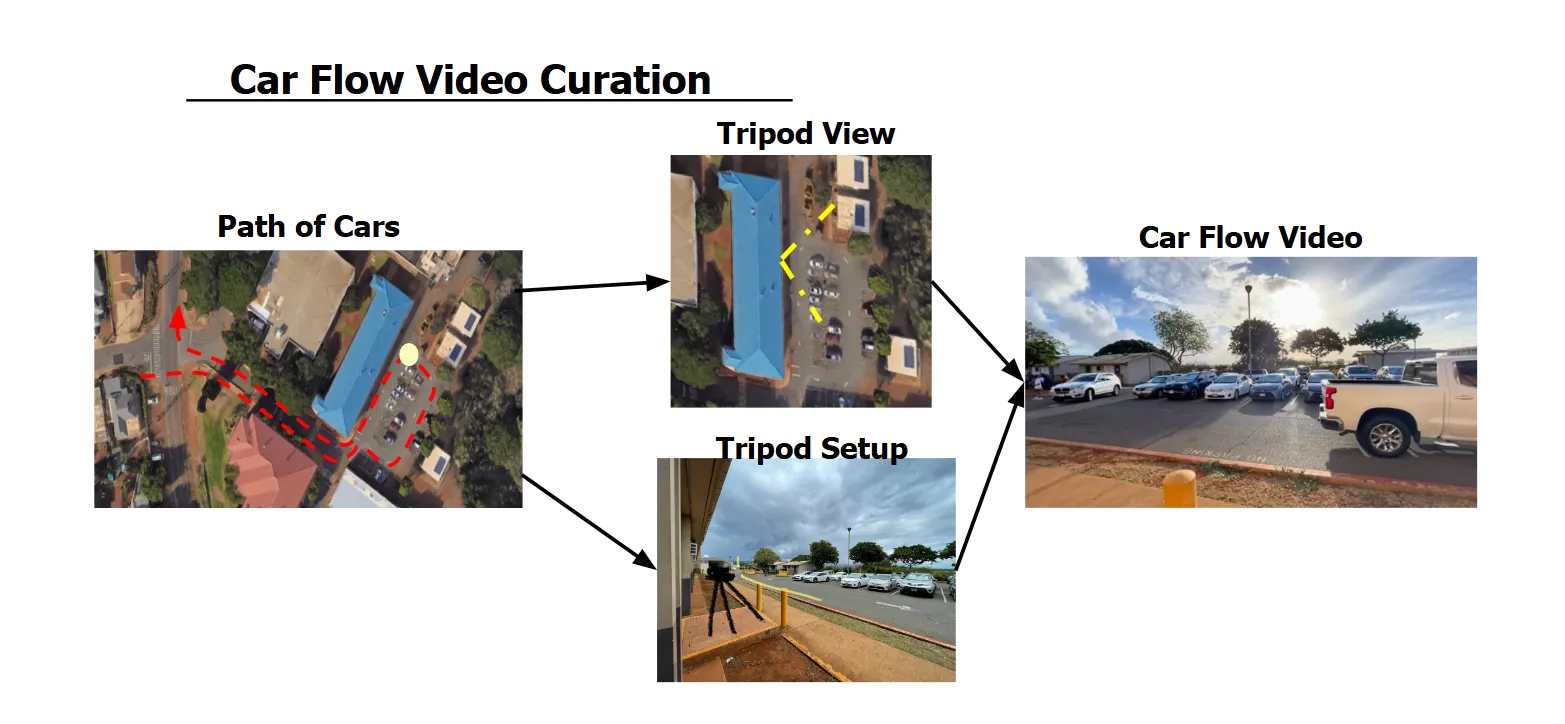
I filmed traffic from a tripod, planning the camera position against the path the cars take through the lot.
Detection and tracking
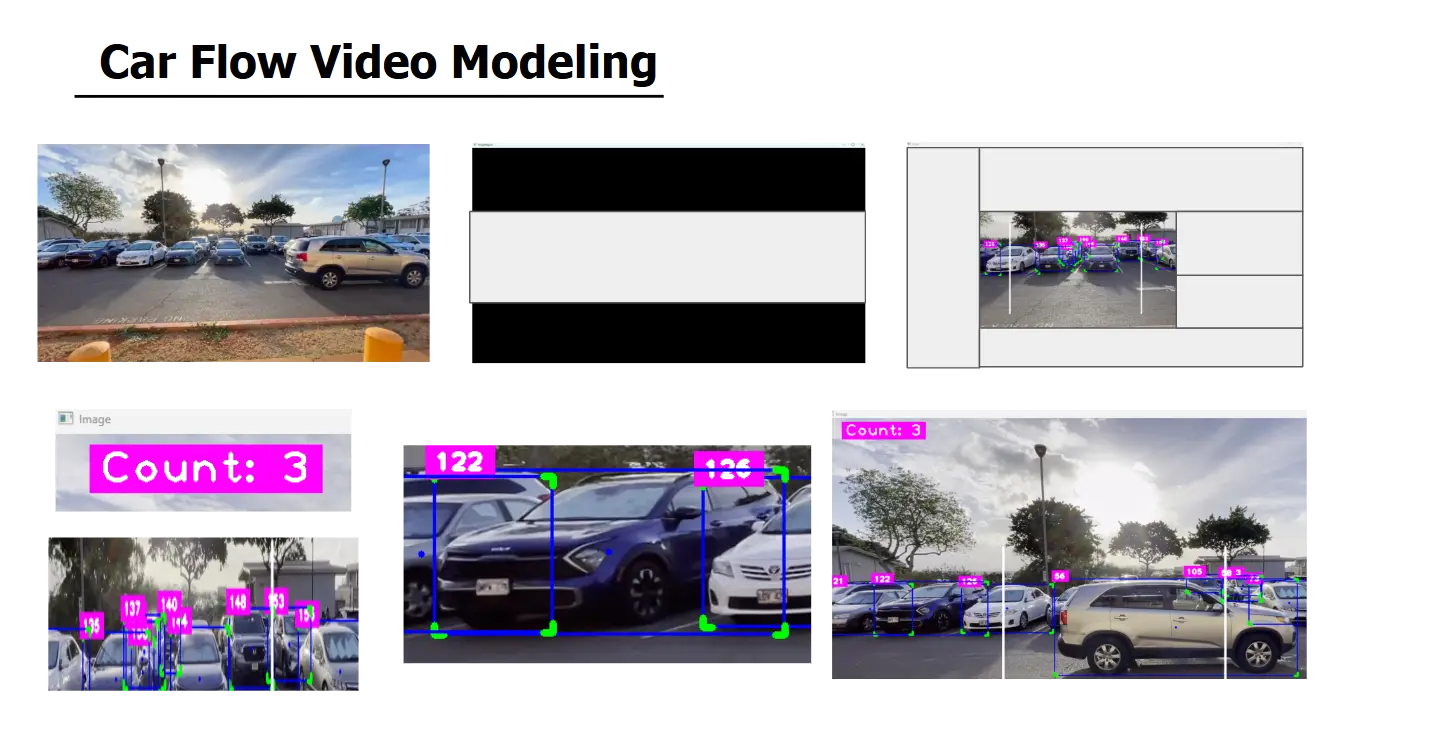
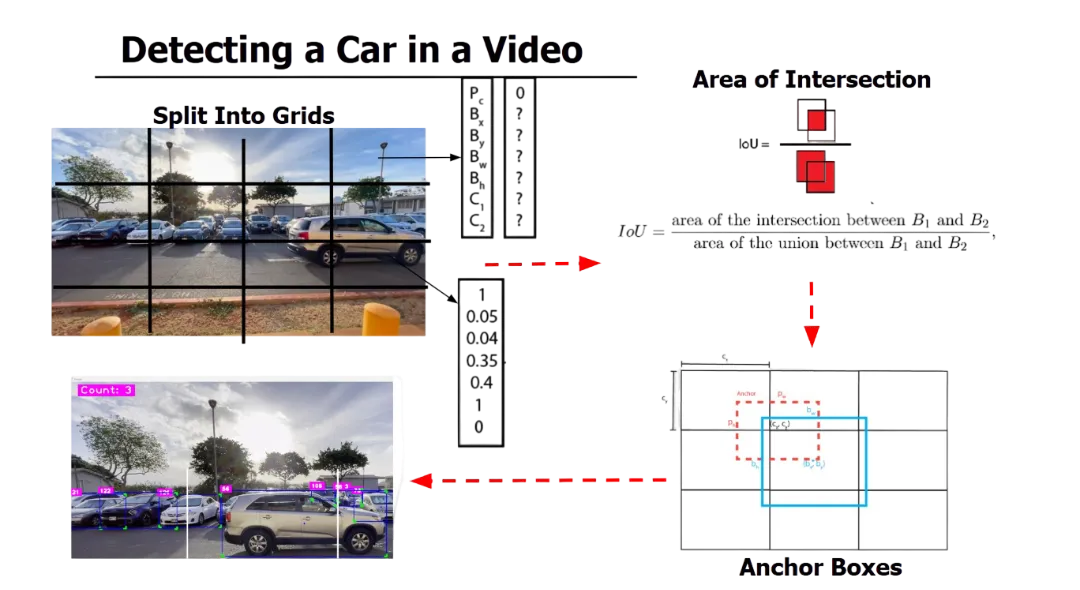
I ran a YOLOv8 convolutional neural network on mosaic imaging, which stitches several high-resolution frames into one composite, so the network can detect and track vehicles across the whole scene at once.
An efficiency equation without the time hyperparameter
With my brother, I wrote a new traffic-efficiency equation that removes the time hyperparameter. We extended it into a two-equation system built for simulation, which minimizes the interquartile range of flow while maximizing efficiency. It supports simulation-based planning of traffic flow. We are working toward a provisional patent on the equation, so I am not publishing it here.
Results
- I field-tested the system for six months, collecting and analyzing traffic patterns.
- After deployment, Hawaii’s head of traffic at the Department of Transportation reported that it cut traffic-data labor by more than 80%.
- It improved the efficiency of Waipahu High School’s traffic methodology by 17%.
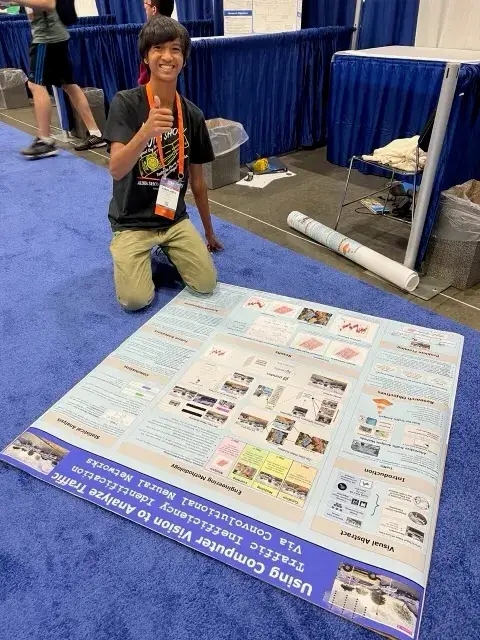
- The project was a finalist at the International Science and Engineering Fair (about 1,600 spots from roughly 7 million students worldwide) and won two special awards there.
My contribution
I built the computer-vision pipeline, did the filming and six months of field testing, and ran the analysis. My brother and I developed the efficiency equation together.
Gallery
3 images